Reading a session dashboard
A session dashboard is one page of results for one training run. It is what opens when you select a row on the Sessions page. The page is a header line followed by rows of charts, maps and scores, and every chart on it reads from the same run.
The layout of the page is decided by the template the run was processed with, not by you. Two sessions from the same template look alike. Two sessions from different templates can look very different. This page explains the parts that behave the same way everywhere.
The header line
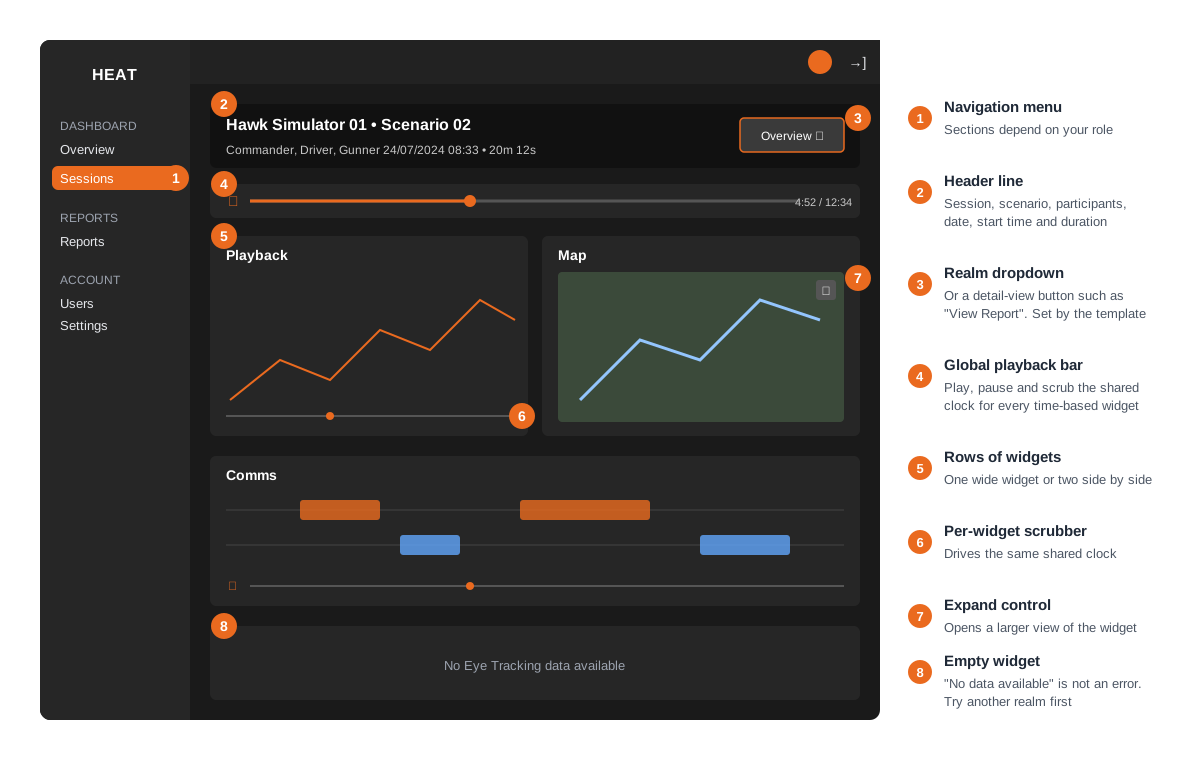
The header repeats the row you selected on the Sessions page. It shows the session name, a dot, and the scenario name. Under it are the participants, the date the training started (DD/MM/YYYY), the start time (24-hour clock) and the duration. When more than three participants took part, the header shows the first three and a “View More” control that expands the rest.

If the run has no start and end time, the header shows only the names.
Rows of widgets
Below the header, the results are arranged in rows. Each row holds one or more widgets. A widget is one block on the page, for example a map, a gauge or a table. A row can hold one wide widget or two side by side. Each widget has a title set by the template.
Read the page top to bottom. Templates usually place summary scores first and time-based charts and maps below them.
The realm dropdown
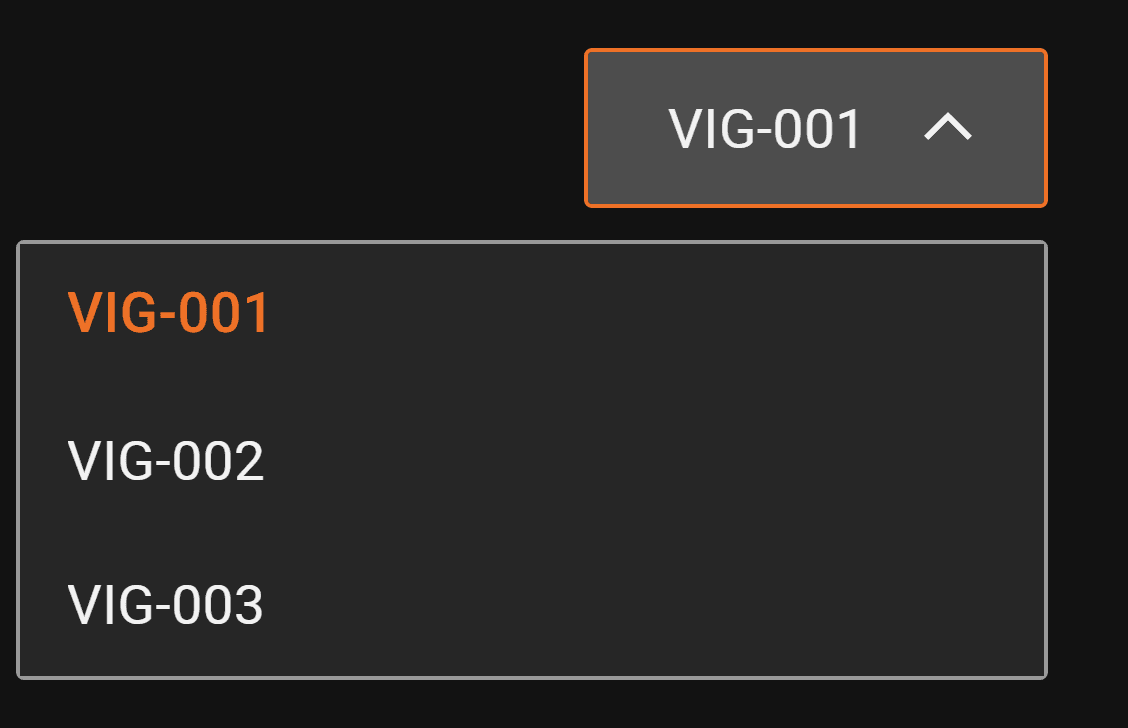
Some templates publish several views of the same run and let you switch between them without leaving the page. A realm is one such view. Switching realm keeps the same layout of widgets but changes what every widget shows. Templates use realms to move between runs of a scenario, between trainees in a crew, or between files that were uploaded together.
When the template defines more than one realm and allows switching, a dropdown appears at the right of the header line. Its label is set by the template. If the template sets none, the label reads “Realms”. The first option is usually “Overview”, which is the whole-run view. Numbered options such as “Vignette 1” and “Vignette 2” are individual segments of the run.
Pick a realm and every widget on the page reloads for it. The playback clock, described next, also switches to that realm. If you see no dropdown, the template has only one view and there is nothing to switch.
Playback and the shared clock
Time-based widgets replay the run. A map shows positions moving, a comms chart shows who was talking, a video shows what a seat saw. All of these follow one clock for the current realm. When the clock moves, they all move together.
The global playback bar
When the template turns it on, a playback bar sits above the first row of widgets. It has a play and pause button, a scrubber you can drag, the elapsed time and the total duration, shown as minutes and seconds such as “0:00” and “12:34”. Playback runs at real speed and stops at the end.

The bar appears only when the run has a start and end time and at least one widget on the page has time-based data. If those conditions are not met, the bar is hidden even when the template asked for it.
Per-widget scrubbers
Some widgets carry their own play button and scrubber inside the widget, for example a comms chart or a tactical map. These controls drive the same shared clock. Pressing play inside one widget starts the others as well, and dragging its scrubber moves every time-based widget on the page. Use whichever control is nearest to what you are watching.
A composable chart can include a scrubber lane of its own, and a video widget follows the clock by default. In both cases the behaviour is the same. There is one clock per realm, and every control on the page is a handle on it.
Switching realm during playback
Each realm has its own clock. When you pick a different realm, the playback bar and every time-based widget show that realm’s clock and position. Playback in one realm does not move the others.
Detail views
Some templates add a button to the right of the header line instead of a realm dropdown. Its label is set by the template, for example “View Report” or “View Fire Mission Report”. Pressing it opens a detail view over the page.
The detail view is a second dashboard laid over the first. It has its own header line, its own realm dropdown when the template defines one, and its own rows of widgets. Playback inside the detail view has its own clock. Close it with the close control in its corner or by clicking outside it, and you are back on the main page where you left it.
Individual widgets can also open a larger version of themselves. A tactical map, for example, offers an expanded view with the same data at full size.
When a widget has no data
A widget with nothing to show displays a short message in place of the chart. The general message is “No data available”. Many widgets name themselves instead. The messages you will see are listed below.
- “No Cognitive Load data available”
- “No Eye Tracking data available”
- “No Map data available” and “No Tactical Map data available”
- “No Flight Path data available” and “No Playback data available”
- “No scoring data available”
- “No Circuit Stats data available” and “No Stats data available”
Inside a composable chart, a single lane can report “No series data”, “No events”, “No ranges” or “No data” while the other lanes draw normally.
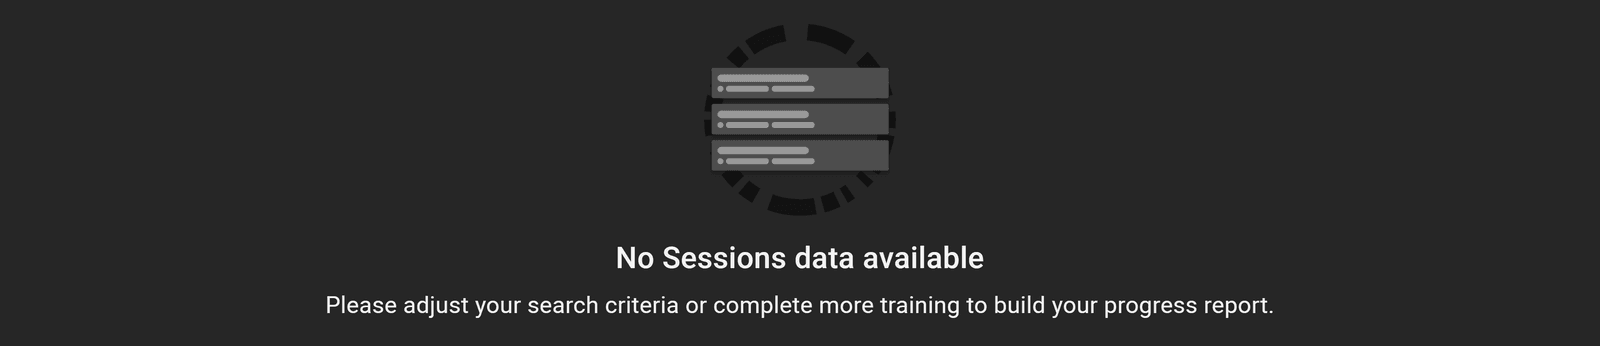
An empty widget is not an error. It means the run did not produce that measurement, or did not produce it for the realm you have selected. Try another realm before assuming the data is missing. If every widget on the page is empty, the run was processed but the capture contained nothing usable, and your instructor should check the source data.
When the page itself cannot load, it shows “Apologies, we have encountered an error”. The advice under it reads “Please try and refresh the page or log out and try again.” When the session address is wrong, it shows “Session not found”. Both are described in Finding your sessions.
Legacy dashboards
HEAT has two generations of session dashboard. Next is the current generation. Legacy is kept for templates that were built before it. The Sessions list contains both, and the dashboard chooses the right one when you open a row.
A Legacy dashboard shows the same header line but looks different below it. It has no realm dropdown and no global playback bar. Each chart carries its own controls, and charts do not share a clock. Nothing on this page about realms or the shared clock applies to a Legacy dashboard.
You cannot switch a session between Legacy and Next. The generation is fixed by the template that processed the run. Ask your developers whether a newer template exists if you need realm switching or a shared clock.
Widgets you will meet
This table lists the widgets a Next dashboard can contain, with the title the dashboard uses for each. “Follows playback” means the widget moves with the shared clock. The links lead to the developer reference for each widget, which describes configuration rather than reading.
| Widget | What it shows | Follows playback |
|---|---|---|
| Bar chart | Bars for categories or time ranges, for example rounds fired per phase. | No |
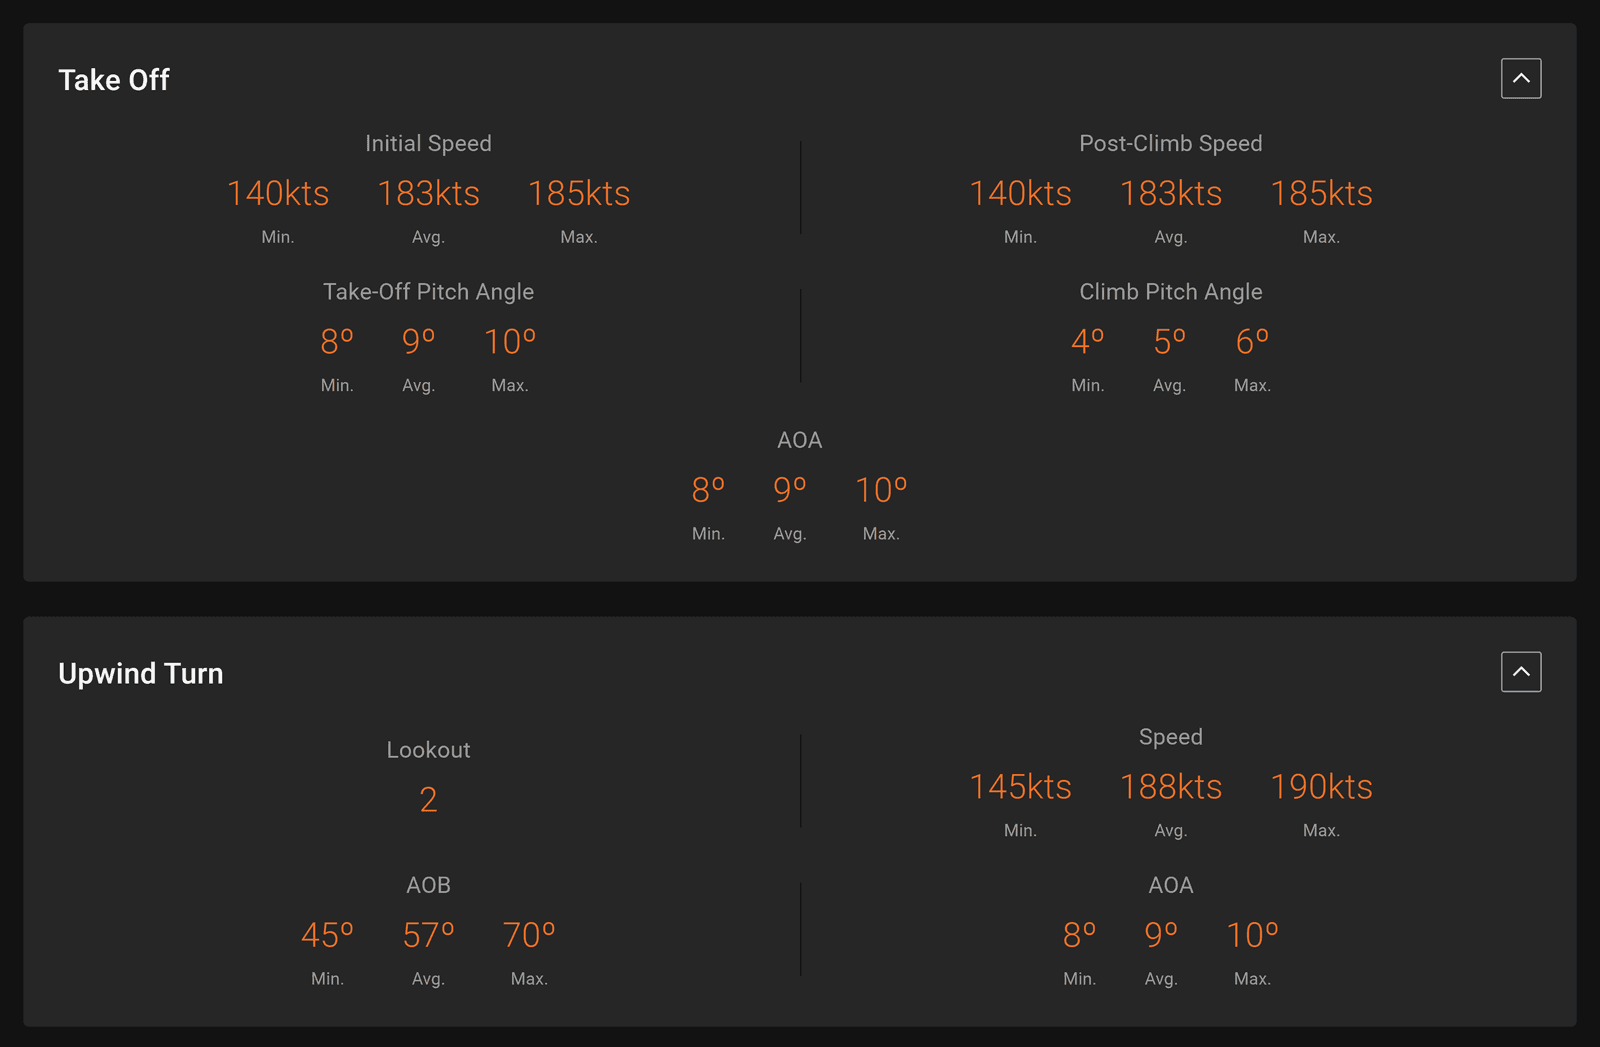
| Circuit Stats | A phase by phase summary of a flying circuit with a metric per phase. | No |
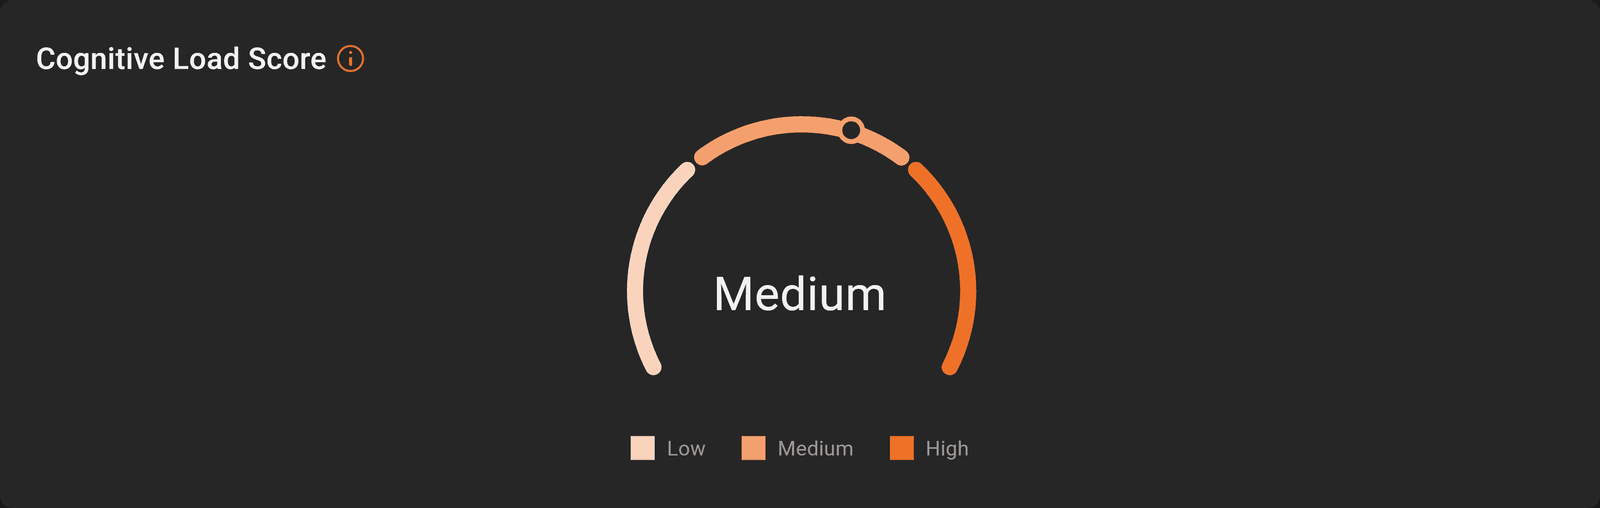
| Cognitive Load | A gauge of mental effort, scored 0 to 21 and banded Low, Medium and High. | Yes |
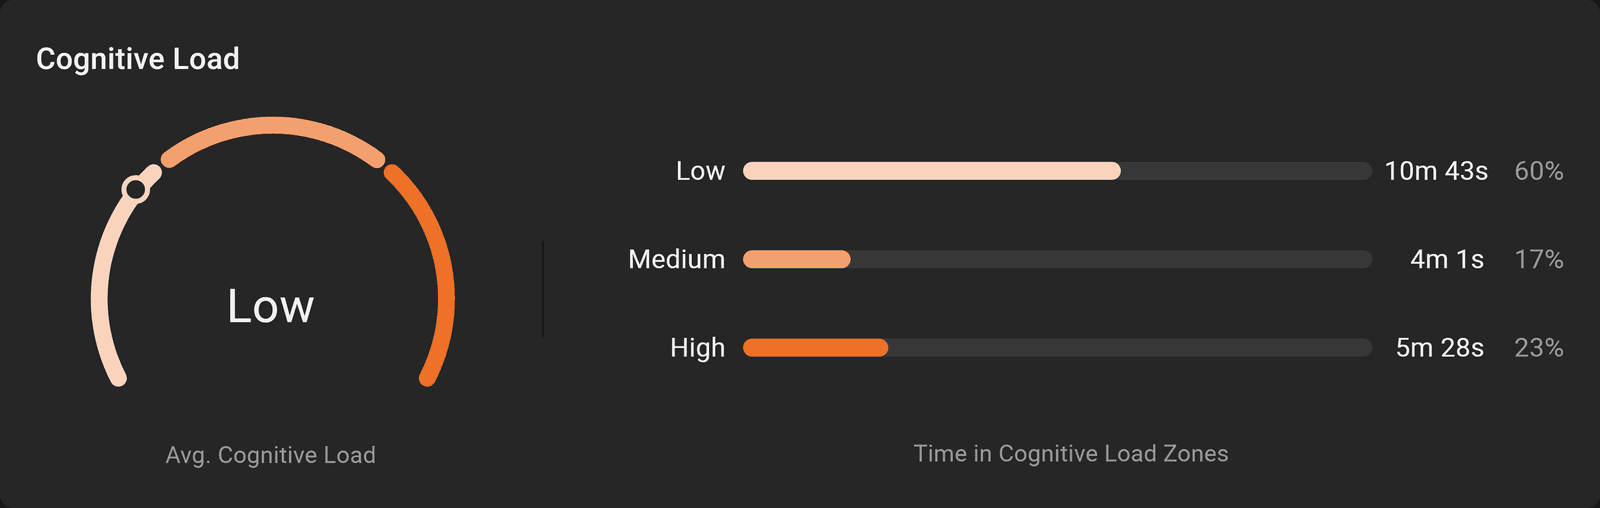
| Cognitive Load Breakdown | The average cognitive load for the run plus how long was spent in each band. | No |
| Comms | Lanes showing when each radio channel or participant was transmitting. | Yes |
| Composable chart | A stack of aligned lanes, such as a speed line, event markers, ranges and a scrubber, that zoom and pan together. | Yes |
| Custom renderer | A template-specific panel drawn by the template author, so its content varies. | No |
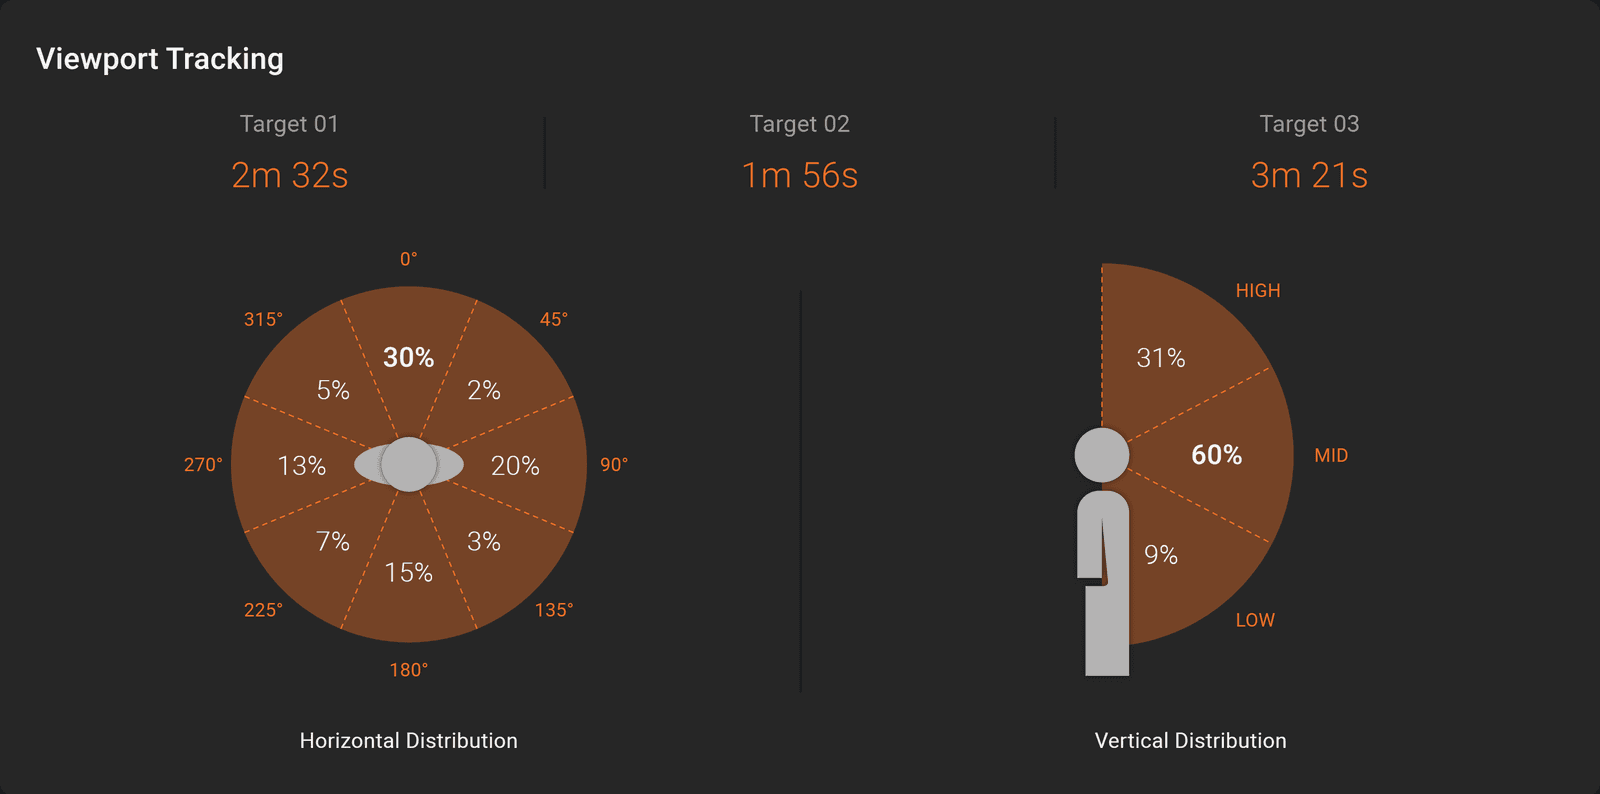
| Eye Tracking | A grid of where the trainee looked, for example nearside, offside, near and far distance. | No |
| Eye Tracking Container | The eye tracking grid with extra framing and titles. | No |
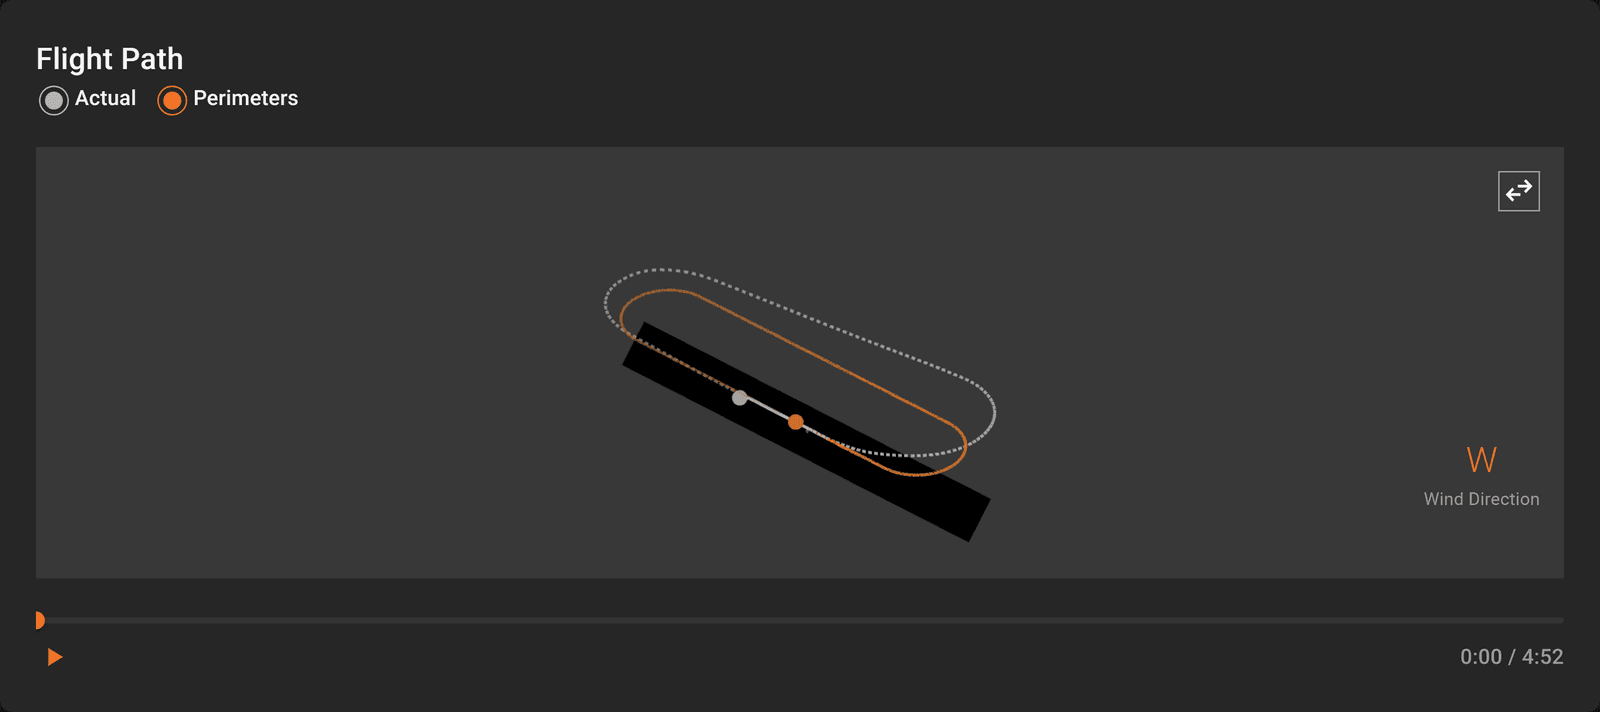
| Flight Path | A three-dimensional track of the aircraft with a scrubber to move along it. | Yes |
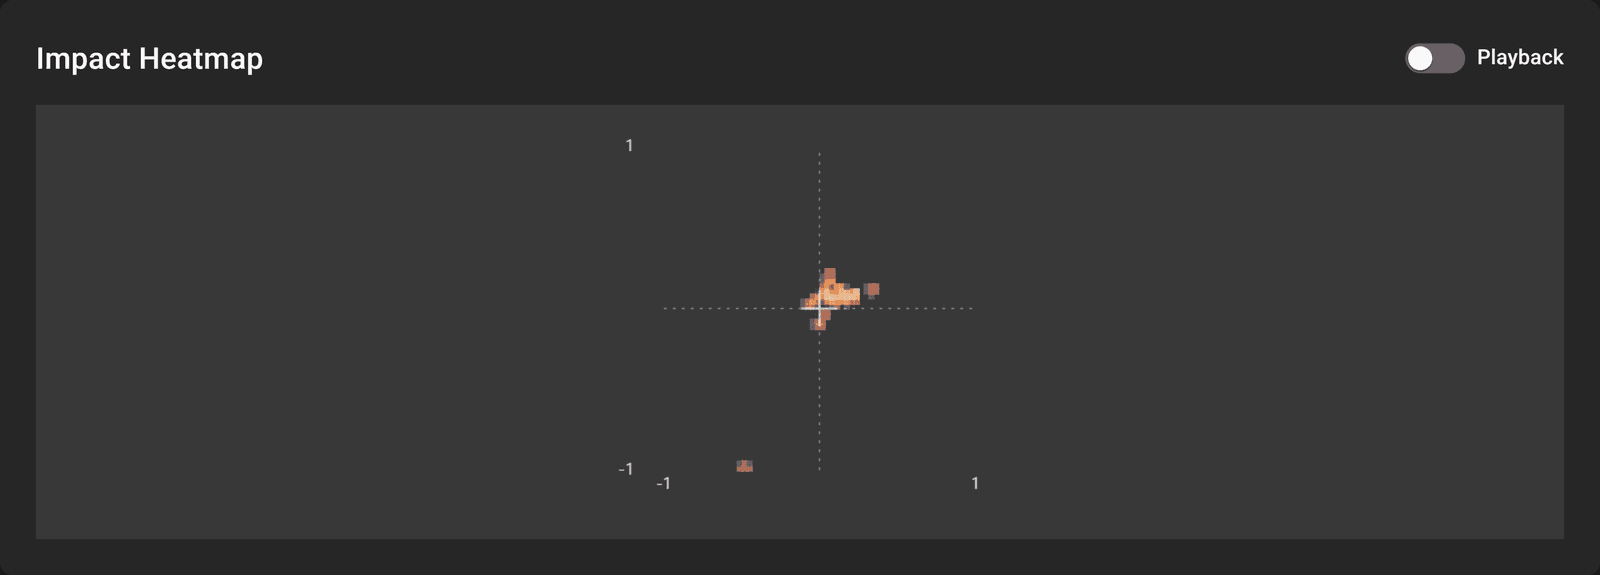
| Impact Heatmap | A scatter of impact points on a target, shaded by density. | No |
| LeaderBoard | A ranked table of participants by score. | No |
| Map | A map with routes and markers that replay as the clock moves. | Yes |
| Modal | The button in the header that opens a detail view, described above. | Yes |
| Progress Score | A score shown as a bar or a ring, with the total it is out of. | No |
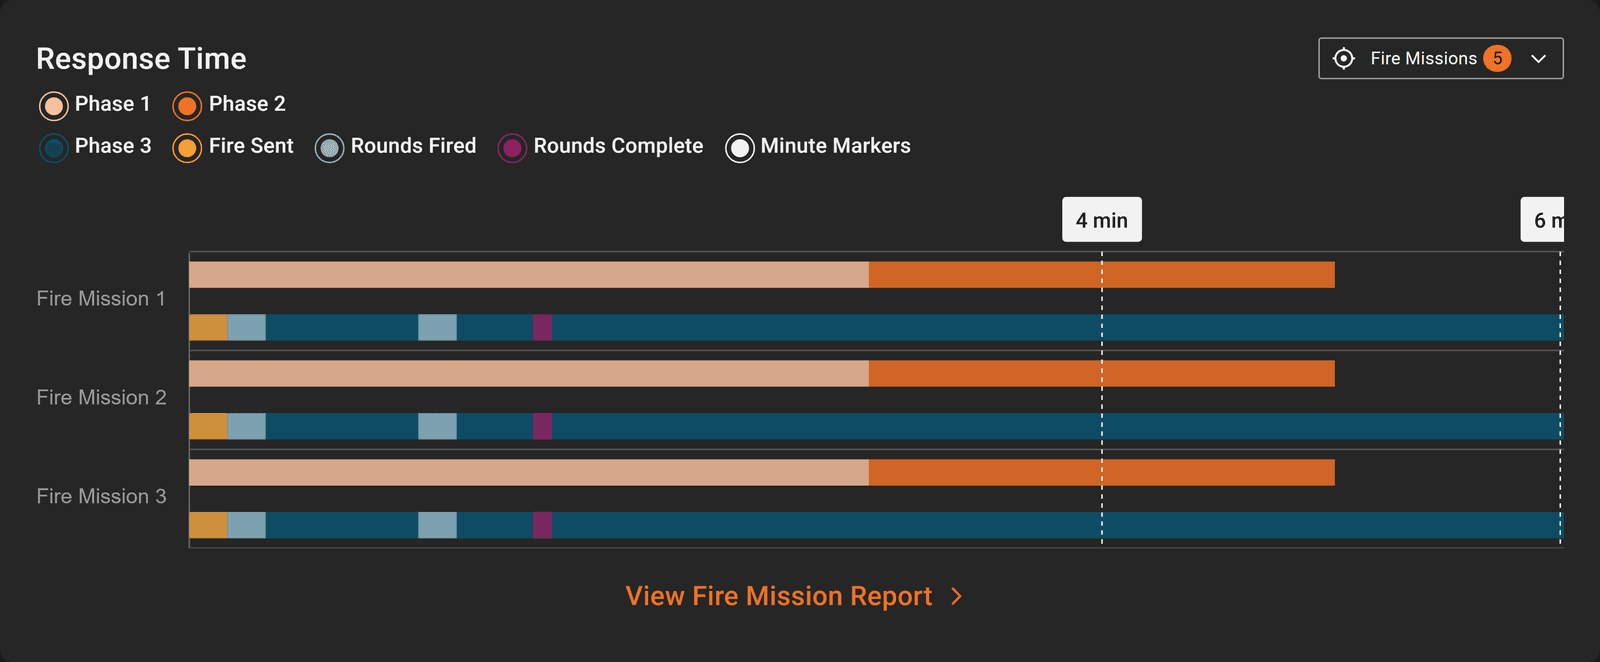
| Response Time | How quickly participants responded, for example to a fire mission call. | No |
| Stats summary | A table of headline numbers, such as duration, distance travelled and targets engaged. | No |
| Tactical Map | A flat map drawn from stored coordinates that works without internet map tiles, with an expanded view. | Yes |
| Timeline | An older stack of time charts. New templates use the composable chart instead. | Yes |
| Video Playback | Video from one or more seats, in step with the clock. | Yes |
Not every dashboard contains all of these. Your template chooses which widgets appear and in what order.
Widget examples
The images below show the common widgets with sample data, so you can recognise them on a page. Titles, colours and the measurements shown are set by the template.
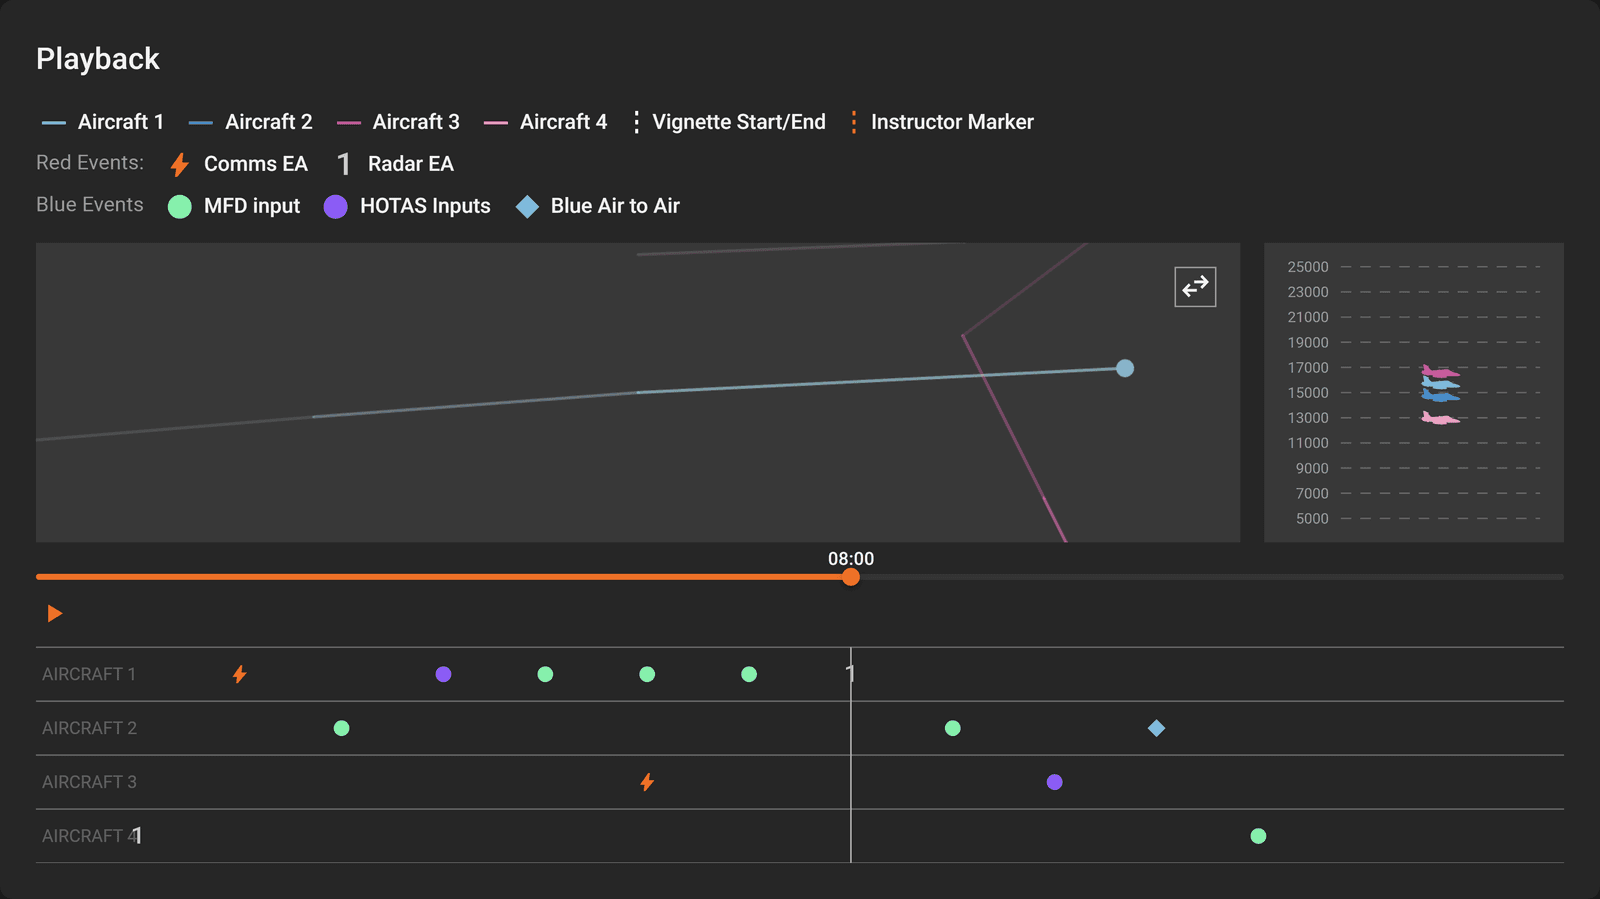
A composable chart stacks aligned lanes. Here a flight track, an altitude profile, a scrubber and event lanes move together.
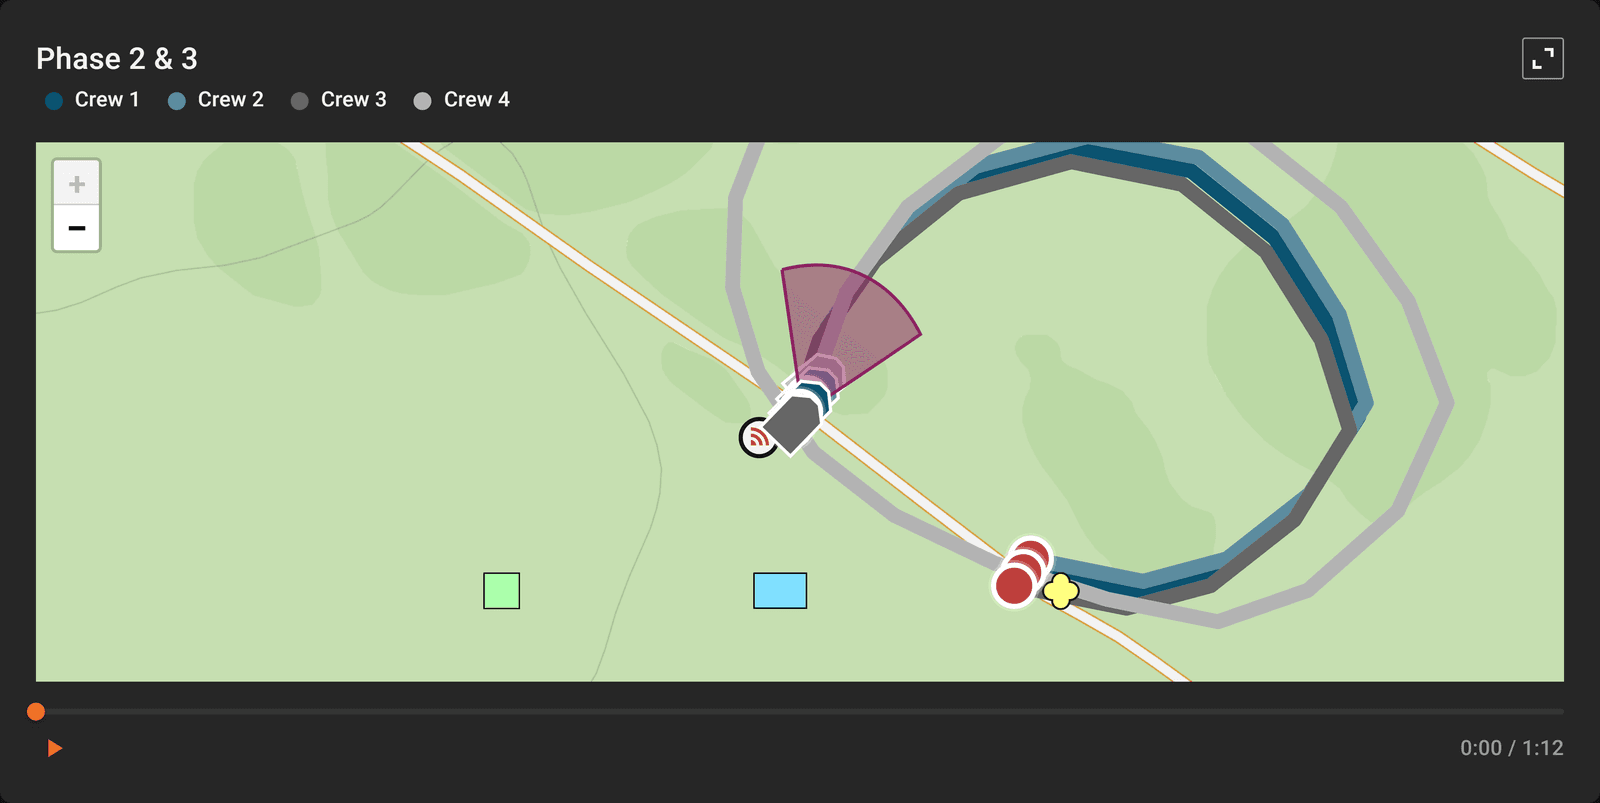
A map replays routes and markers as the clock moves. The scrubber under it is a handle on the shared clock.
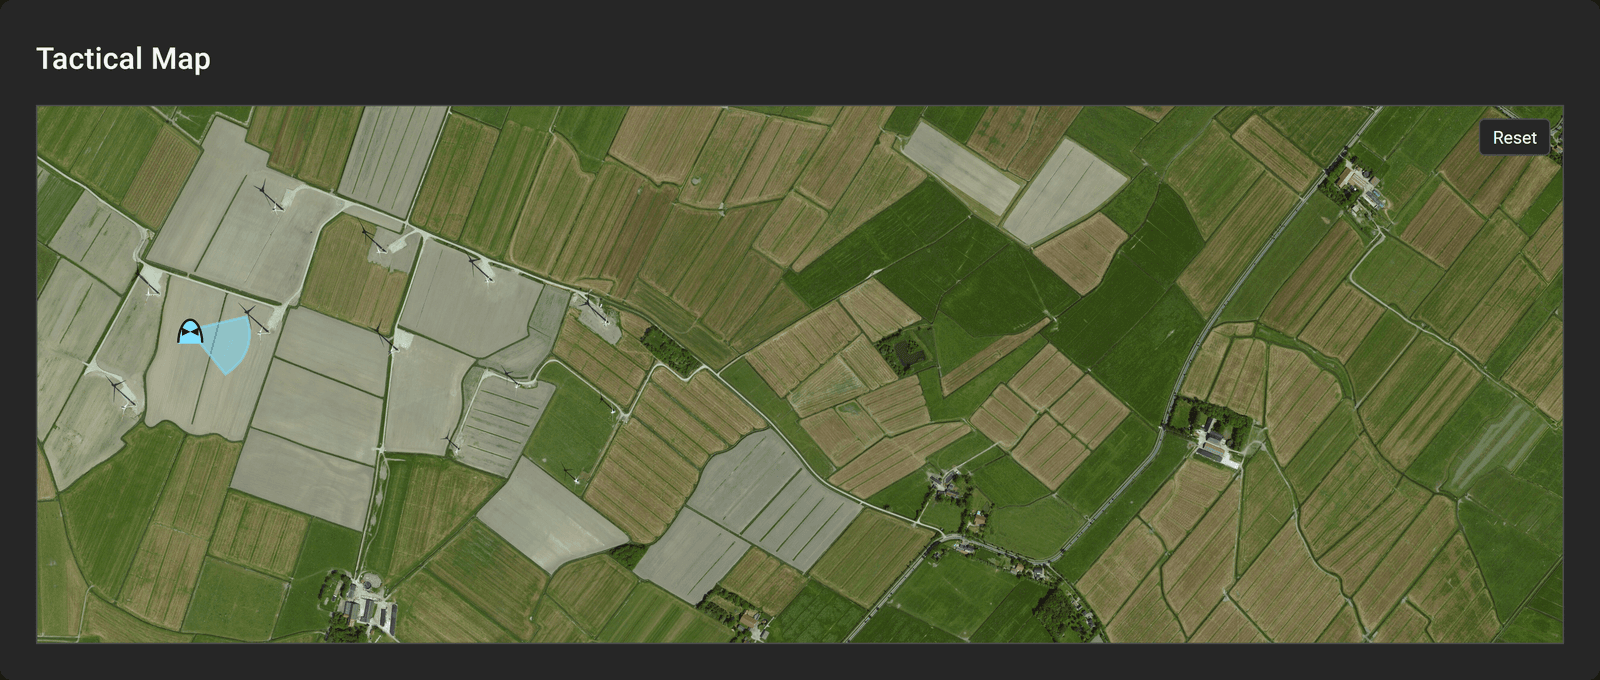
A tactical map is drawn from stored coordinates, so it works without internet map tiles. “Reset” returns the view to its starting position.
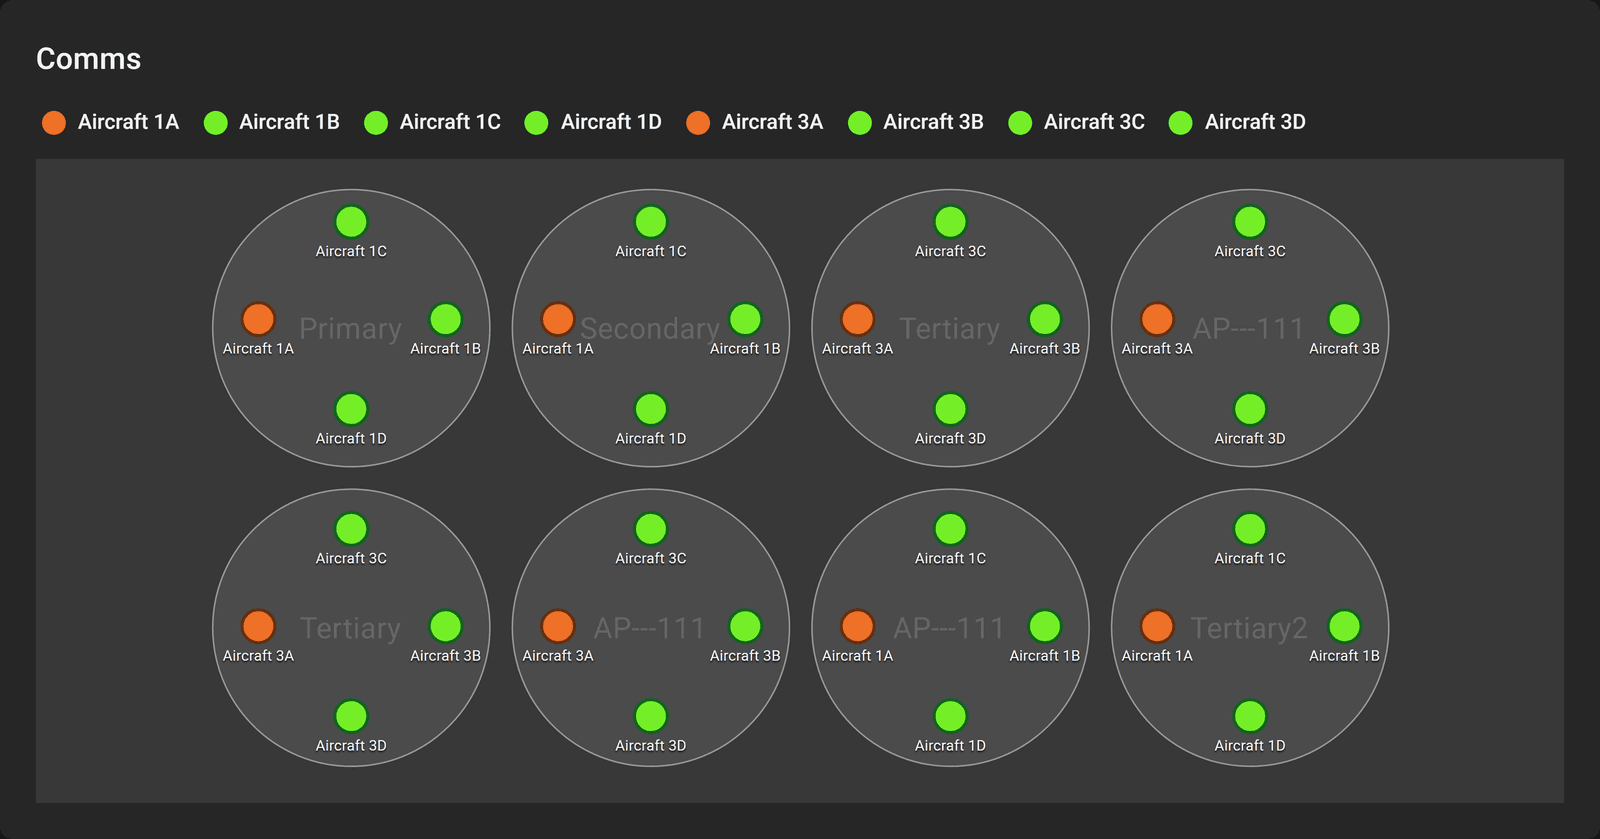
A comms widget shows who was on each net.
Cognitive load is a gauge of mental effort, banded Low, Medium and High. The breakdown widget adds the average and the time spent in each band.
Eye tracking shows where the trainee looked, as a horizontal and a vertical distribution.
A flight path draws the aircraft track against the expected perimeters, with a scrubber to move along it.
A leaderboard ranks participants by score. A progress score shows one score as a ring or a bar, often with a button that opens a detail view.
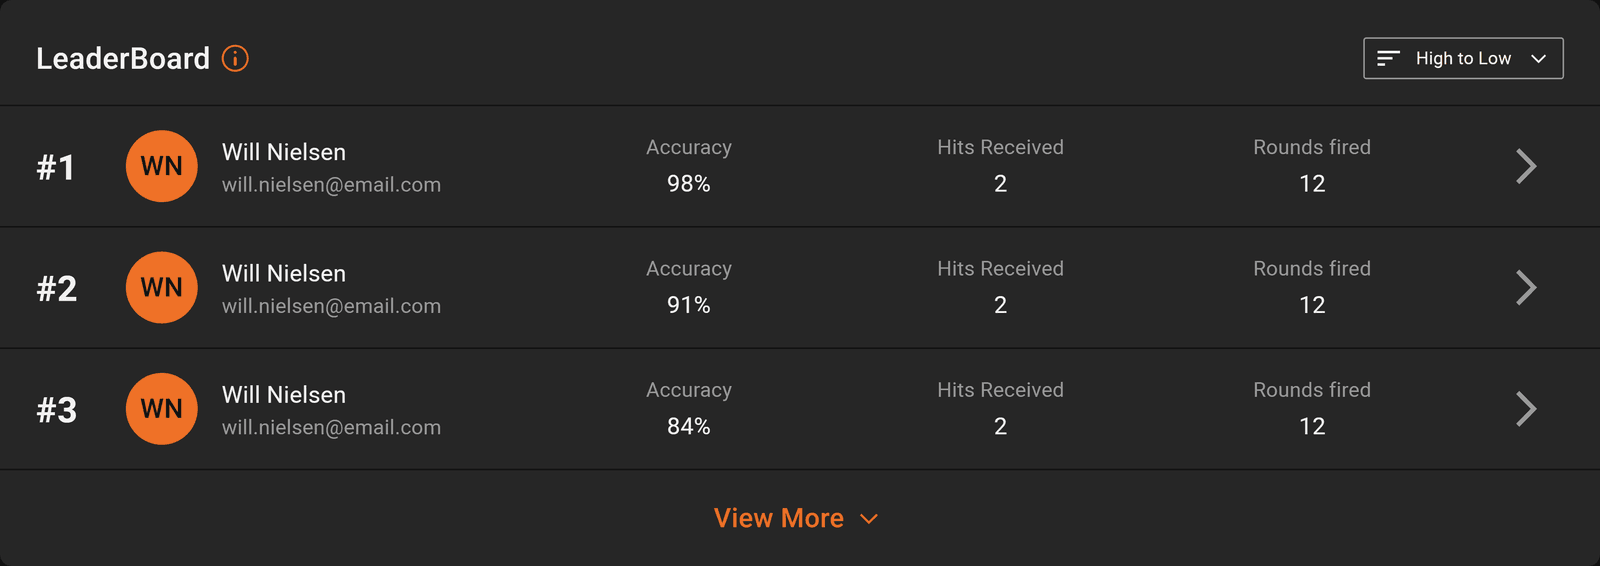
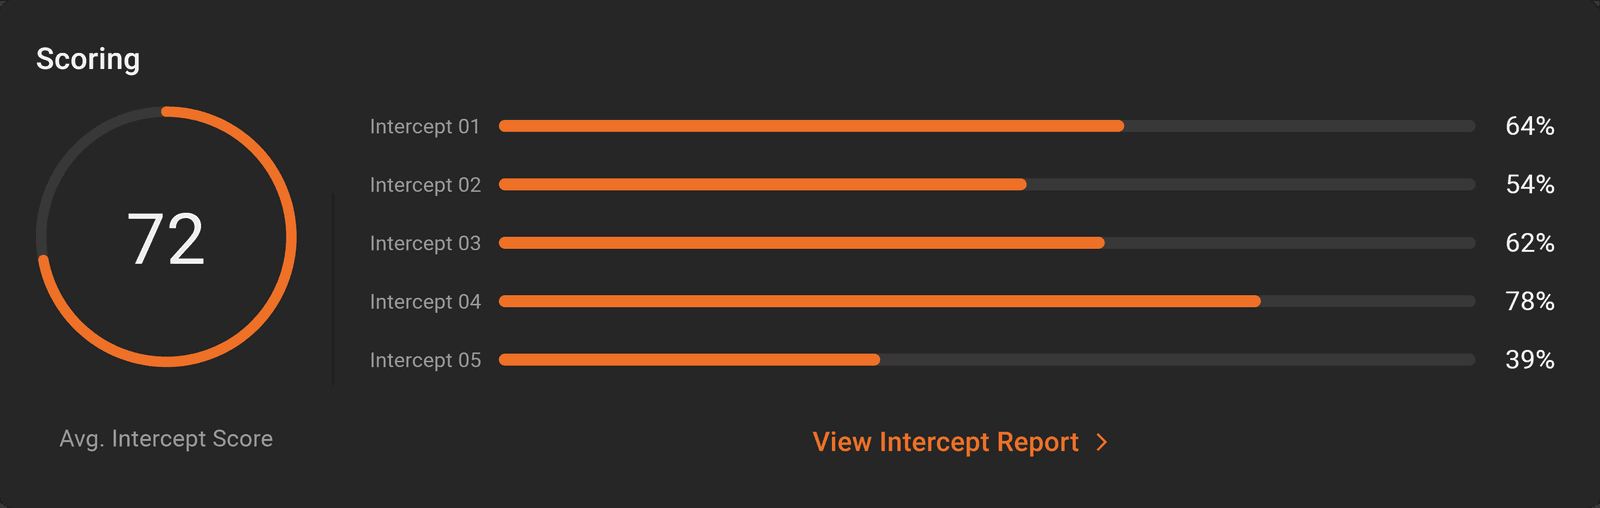
A stats summary is a grid of headline numbers. A bar chart compares categories. Response time lays out phases and events on a timeline per fire mission. An impact heatmap shades impact points on a target by density.
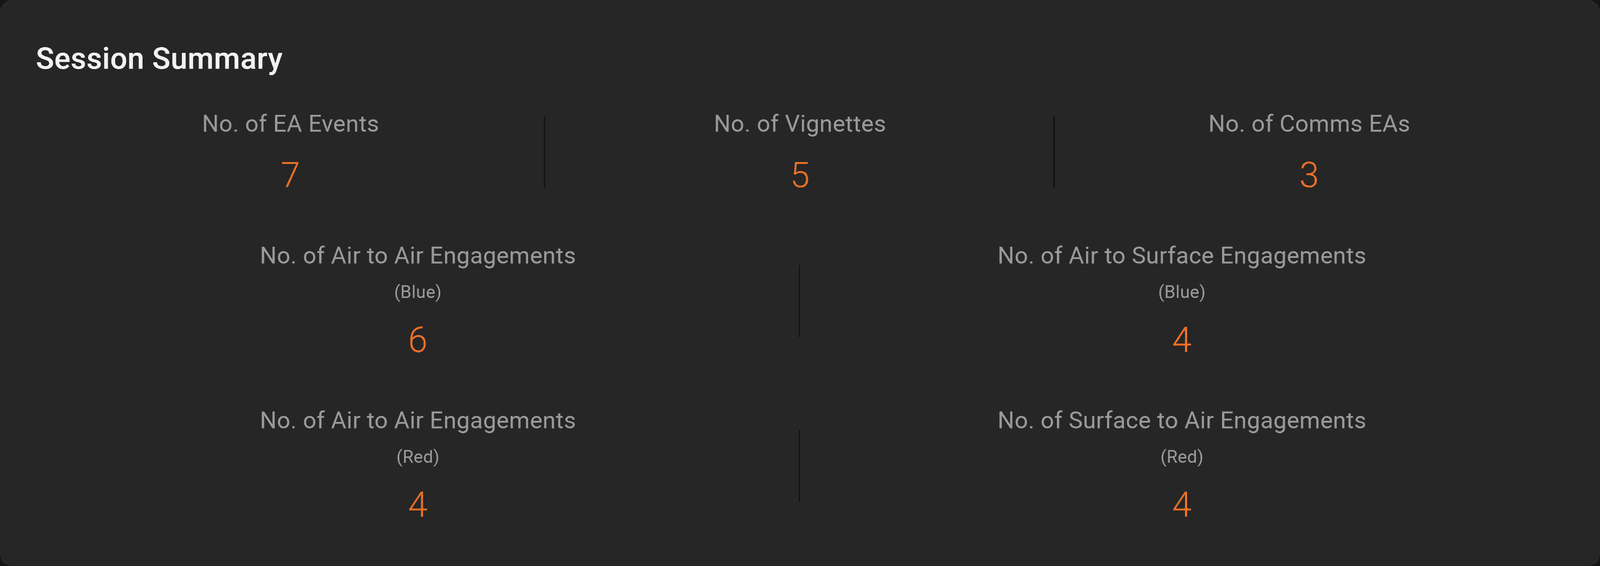
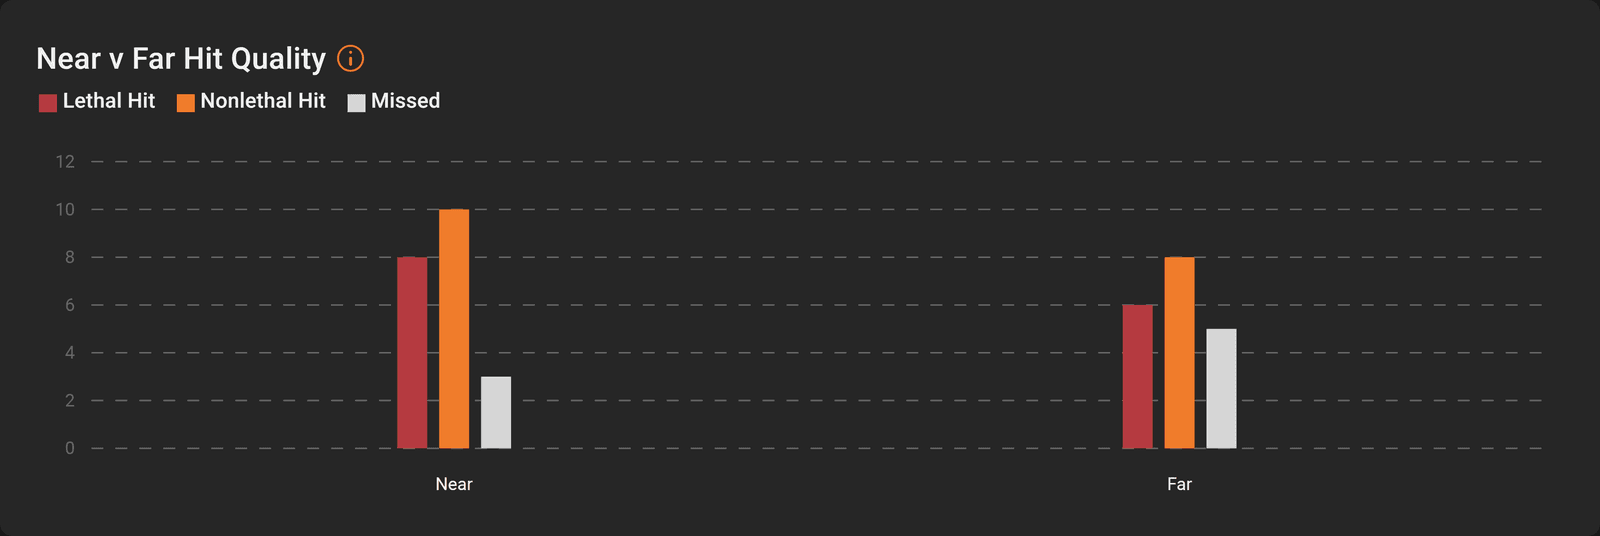
Circuit stats summarise a flying circuit phase by phase, with the minimum, average and maximum of each measurement. Each phase folds away with the control in its corner.