The HEAT dashboard
The HEAT dashboard is the web application where instructors and trainees read the results of a training run. You sign in, pick a session from a list, and read the charts that HEAT produced for it. If your organisation runs an after action review (AAR) after each training run, the session dashboard is the record you review.
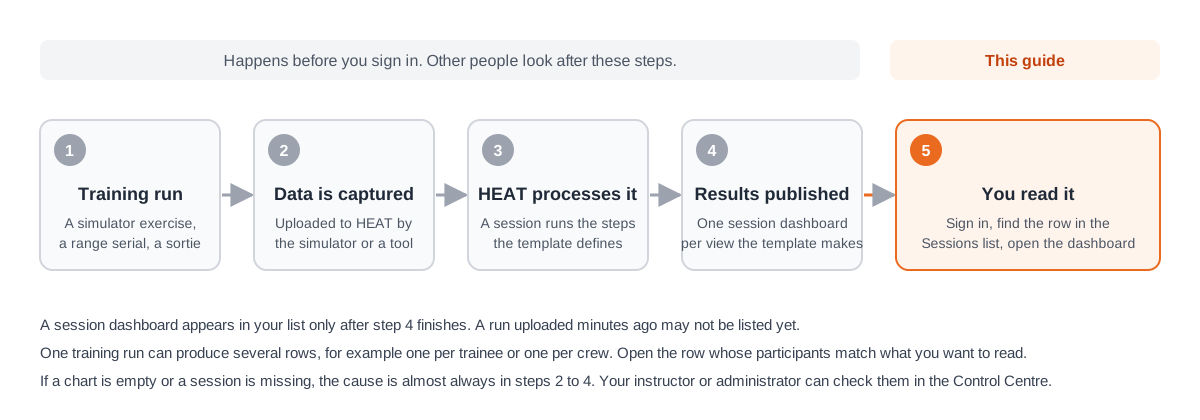
The dashboard shows results only. It does not capture data, run analysis or change how a training run is processed. Those steps happen before a session appears in your list, and other people look after them. If a session is missing or a chart is empty, the cause is almost always upstream of the dashboard.
Who uses it
Four roles sign in to the dashboard. Each role sees a different amount of it.
| Role | Typical reader | What they read |
|---|---|---|
| Trainee | A person who took part in training | Their own sessions |
| Instructor | A person who runs or reviews training | Every session, plus reports and the Overview |
| Administrator | A person who looks after dashboard accounts | Everything an instructor sees, plus the Users page and system views |
| Developer | A person who builds data flows for HEAT | The same as an administrator |
Signing in and roles covers each role in detail and where it lands after sign-in.
What a session is
A Session is one run of training over one batch of data. In the dashboard you never see the processing itself. You see the session dashboard it produced, which is a page of charts, maps and scores for that run.
One training run can produce more than one session dashboard, for example one per trainee or one per crew. Each appears as its own row in the Sessions list, so the same run can be listed more than once. Finding your sessions explains how to read the list.
Navigation
The navigation menu sits on the left of every page. It is grouped into sections, and the sections you see depend on your role. The labels below are the ones shown on screen.
| Section | Item | Who sees it | What it is for |
|---|---|---|---|
| Dashboard | Overview | Instructor, Administrator, Developer | Progress and benefit summaries across trainees and time, with the same date and trainee filters as the Sessions list |
| Dashboard | Sessions | Every role | The list of session dashboards you may open |
| Reports | Reports | Instructor, Administrator, Developer | Download a report of sessions as a spreadsheet file, for example “Sessions Log - CSV file” |
| Account | Users | Administrator, Developer | Invite users, change roles, activate or deactivate accounts |
| Account | Settings | Every role | Change your password or request account deletion |
| System | System views | Administrator, Developer | Dashboards that HEAT itself publishes, for example resource monitoring |
Overview appears only when your environment has it enabled. If it is not present, the Dashboard section starts at Sessions.
System views are not results of a training run. They are dashboards the platform publishes about itself, and they refresh on a schedule. They open in the same page layout as a session dashboard. Instructors and trainees do not see this section, and the dashboard sends them back to Sessions if they open a system view address directly.
The header at the top of the page holds the Log Out control. Logging out asks “Are you sure you want to log out?” before it signs you out.
What you cannot do here
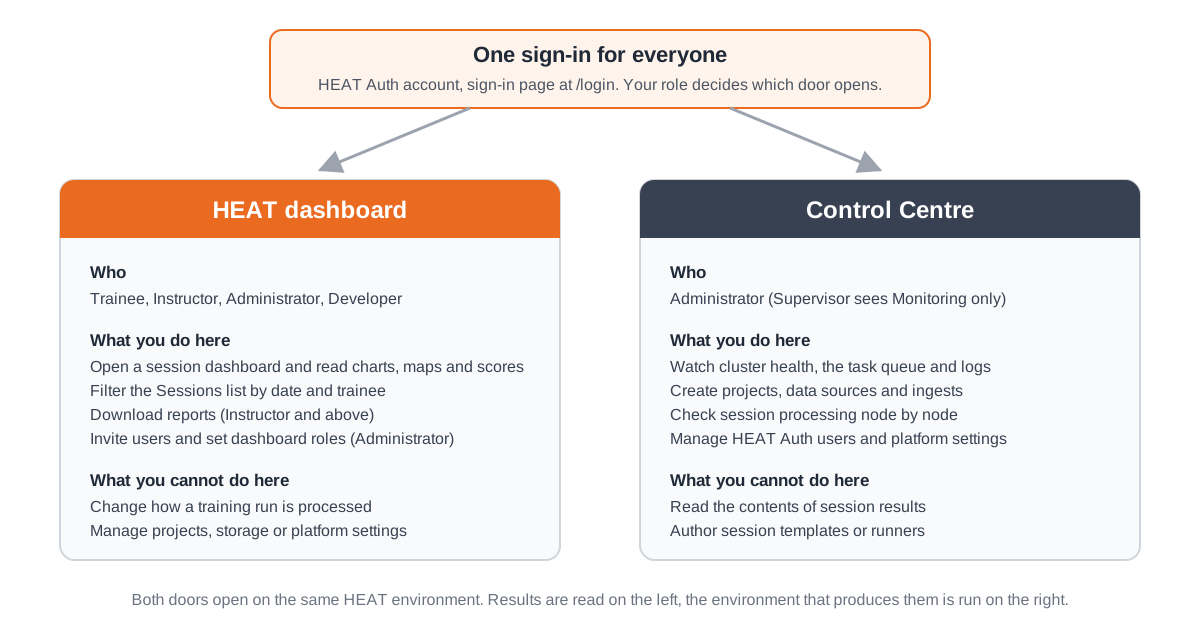
The dashboard does not let you build or change the analysis. Session templates, node templates and runners are set up by developers. The Developers tab of this site covers that work, starting with session templates.
The dashboard does not let you manage the platform. Identity, projects, data sources and platform settings live in the Control Centre, the operator portal for a HEAT installation. The Administrators tab of this site documents it screen by screen.
The Users page in the dashboard invites people and sets their dashboard role. It does not replace the Control Centre for identity management.
If you cannot find a session you expect, or a chart reads “No data available”, read Finding your sessions and Reading a session dashboard before contacting your administrator. Both pages list the usual causes.